
A hydraulic fault rarely announces itself cleanly. More often, it starts as a pressure dip that only happens on the afternoon shift, a cylinder that hesitates once every few cycles, or a power pack that sounds slightly harsher under load but behaves normally when someone stands beside it with a pressure gauge.
That's exactly why thermal imaging inspection earns its place in serious maintenance work. It gives you another layer of evidence without stripping the machine down first. Heat tells you where energy is being lost, where fluid is bypassing, where restriction is building, and where friction is rising before the fault turns into downtime.
On hydraulic equipment, that matters because many failures don't begin as obvious leaks. They begin as inefficiency. A relief valve passing when it shouldn't. A cooler no longer pulling heat out of the return line. A pump generating more casing heat than it should. If you catch those patterns early, you don't just fix a symptom. You stop collateral damage to seals, hoses, motors, valves and production schedules.
Beyond the Naked Eye Identifying Hidden Hydraulic Faults
A common workshop problem goes like this. The machine still runs. The operator reports sluggish movement after warm-up. Pressure checks look acceptable at first glance. Oil level is fine. Filters were changed recently. Nothing is visibly broken.
But the machine isn't right.
In cases like that, a thermal scan often narrows the search fast. You start seeing what the naked eye can't. One section of valve bank runs warmer than the rest. The return line downstream of a suspect component shows more heat than expected. The pump body has a localised hot area that doesn't match the load pattern. Those clues don't replace pressure testing, but they tell you where to test first.
That's the practical value. Thermal imaging doesn't magically diagnose a hydraulic system on its own. What it does well is convert hidden heat behaviour into something you can compare, question and act on.
Thermal images are most useful when the fault is intermittent and the machine can still be run safely under a repeatable load.
On difficult jobs, I like to pair thermal evidence with other non-invasive checks before reaching for spanners. If access is poor, a visual inspection tool can help confirm what the camera can't see directly. Something like an HD1080p sewer borescope is useful for looking into cramped guards, behind reservoir assemblies, or around hose routings where oil staining, chafing or component damage may support what the thermal image suggests.
What thermal imaging helps you catch early
- Pump inefficiency: Rising casing heat can point to internal leakage or excess friction.
- Valve problems: A hot relief path or uneven heat across a valve manifold often suggests fluid is moving where it shouldn't.
- Cooling issues: Return oil staying hotter through the cooling circuit can flag poor heat rejection.
- Restrictions: Filters, hoses and fittings can show an abnormal temperature pattern when flow is being forced through a narrowing path.
Used properly, thermal imaging moves fault-finding from guesswork to evidence-led maintenance.
Preparing for a Successful Thermal Inspection
A good scan starts long before the camera comes out of the case. Most bad thermal work isn't caused by the camera. It's caused by poor preparation, unstable conditions, or someone rushing straight to the hot-looking part without first making the job safe.
For hydraulic systems, the first question is simple. What are you trying to prove or rule out? If the complaint is slow actuation after warm-up, your target list will be different from a job involving repeated hose failures or suspected cooler underperformance.
Start with the right equipment
The camera spec matters. The UK Thermography Association states that members must use cameras with at least a 320 × 240 pixel detector as the minimum specification for building thermography, which sets an important baseline for professional inspection quality in the UK (UK Thermography Association guidance). In practical hydraulic work, that resolution helps you separate a genuine component hot spot from a vague patch of colour.
A low-resolution image can still look impressive on screen. That doesn't mean it's precise enough to trust when you're trying to distinguish temperature differences across a pump housing, valve coil area, cooler face, or hose connection.

Control the conditions
Environmental control is often ignored in industrial work because the plant is busy and the machine is available now. That's understandable, but poor conditions can ruin the reading.
For UK thermographic surveys compliant with BS EN 13187:1999, a minimum internal-to-external temperature differential of 10°C is mandatory, and inspections should be carried out in dry conditions with wind speeds below 5 m/s because higher wind can cool surfaces and make the data pointless (RICS guidance on conducting a thermographic survey). Those figures come from building thermography, but the underlying lesson transfers directly to plant work. If the environment is altering surface temperature faster than the machine is creating a fault signature, your image will mislead you.
For hydraulic inspection, check these before you begin:
- Stable operating state: The machine must be running in a repeatable way. Scanning during warm-up, idle drift or random duty cycles makes comparison harder.
- Dry surfaces: Oil film, standing water and contamination affect what the camera sees.
- Air movement: Fans, open doors and drafts can cool one side of a component and create a false story.
- Access angle: Shiny metal viewed at the wrong angle can reflect surrounding heat rather than showing its own temperature.
If your team already tracks trends, link the inspection to broader temperature monitoring services so the thermal image isn't treated as a one-off snapshot.
Safety comes first
This is not optional. In the UK, thermal imaging surveys are identified as a legally required component for compliance with the Electricity at Work Regulations 1989 and the Health & Safety at Work Act 1974 in the context of maintaining safe electrical installations (electrical thermal imaging compliance FAQ). On mixed hydraulic and electro-hydraulic systems, that matters because you're often scanning power packs, motor starters, control panels and solenoids in the same job.
Before any scan, complete a basic pre-job review:
- Confirm isolation boundaries: Know what stays live, what's guarded, and what can move unexpectedly.
- Assess stored energy: Hydraulic accumulators, suspended loads and trapped pressure can outlast a shutdown.
- Wear the right PPE: Face protection, gloves, eye protection and site-specific kit should match the hazard, not the convenience.
- Plan your route: Don't improvise access around rotating couplings, fan guards or hot pipework.
Field check: If you can't explain how the component is loaded at the moment you scan it, you're collecting pictures, not inspection data.
Calibrating Your Equipment for Accurate Hydraulic Readings
A thermal camera can produce a convincing image while giving you poor measurement data. That's the trap. On hydraulic equipment, the difference between a useful scan and a misleading one usually comes down to setup.
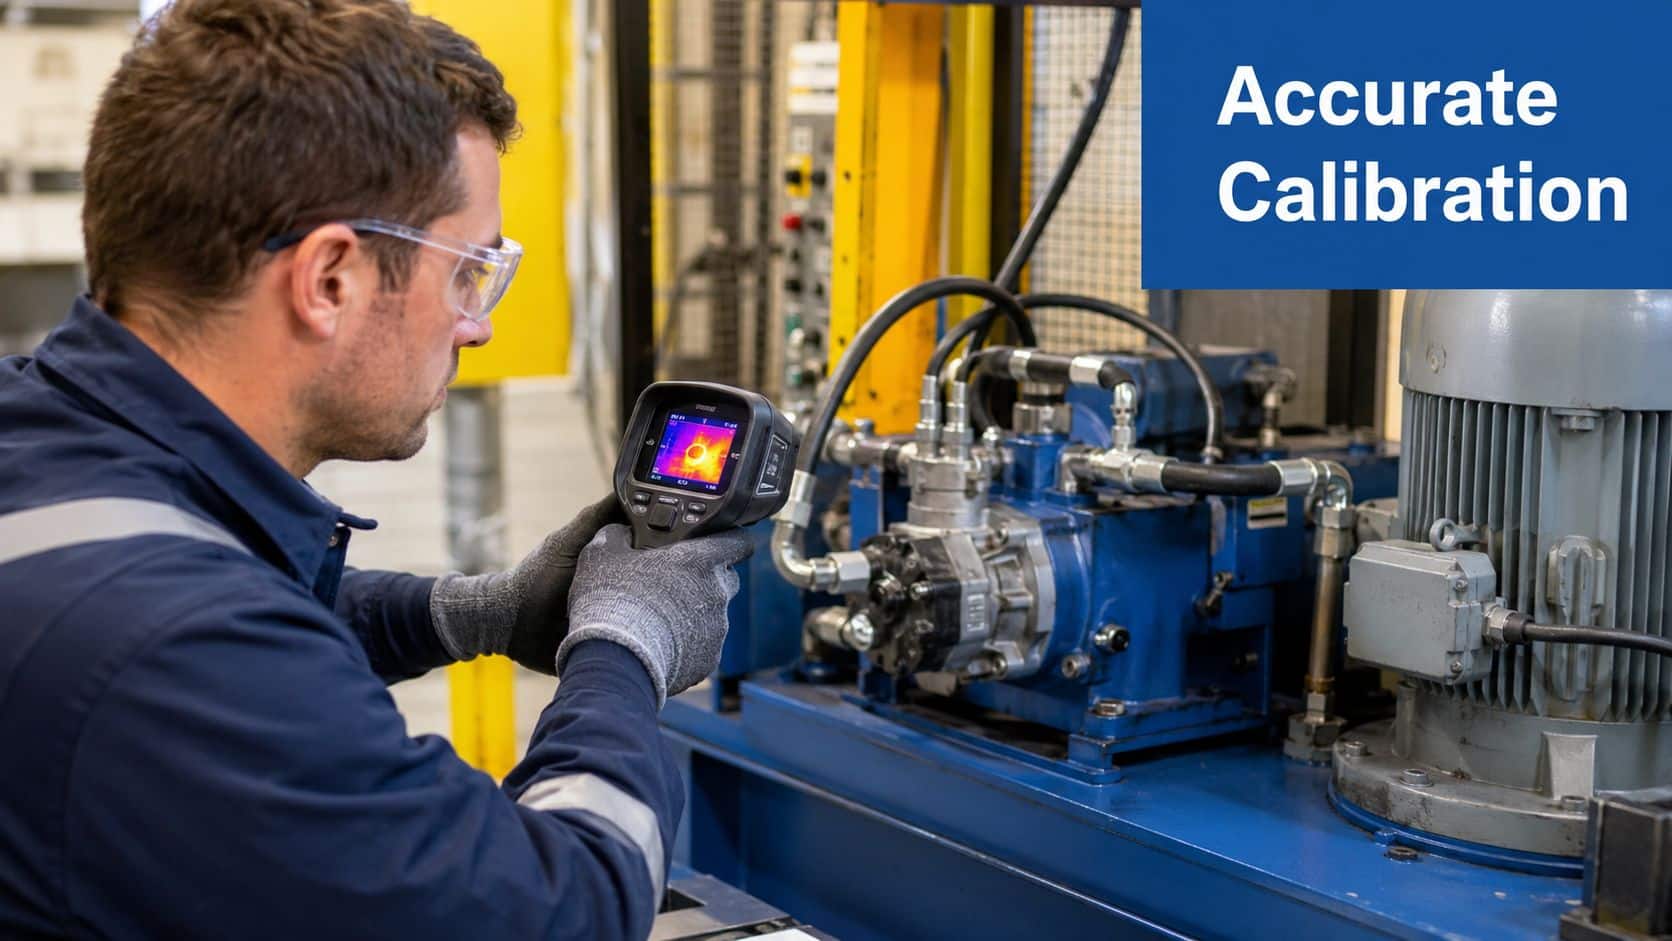
The biggest offender is emissivity. Most hydraulic components aren't friendly surfaces for infrared measurement. Pump housings, valve blocks, manifolds, tube fittings and polished metal covers can all reflect surrounding heat and distort the apparent temperature.
Don't trust the default emissivity setting
In UK industrial and hydraulic system inspections, failing to adjust emissivity settings for materials like metal pumps or valves can lead to temperature reading errors of up to 15–20% if left uncalibrated. The same source notes that high humidity above 70% also distorts readings by interfering with infrared transmission (Visual Perspectives on thermal imaging survey pitfalls).
That's a serious error margin when you're deciding whether a valve section is behaving normally or bypassing under load.
Practical ways to improve the reading
You don't need to overcomplicate this, but you do need discipline.
- Use a consistent target surface: Painted housings and oxidised metal usually read more reliably than clean, shiny bare metal.
- Avoid reflective angles: If the component acts like a mirror, shift your position before trusting the temperature.
- Compare like with like: Scan similar components under similar load, not random points around the machine.
- Record ambient conditions: Humidity, airflow and nearby heat sources can explain odd readings later.
- Set the range deliberately: A very wide temperature span can flatten subtle differences that matter in hydraulic diagnosis.
A good rule is to treat metallic hydraulic parts as suspect until you've checked the image against the visual view and the operating context. If the hottest point seems to move when you move, you may be seeing reflection rather than component temperature.
Shiny valve blocks often “borrow” heat from whatever sits opposite them. That can be a hot motor, a heater line, or even sunlight through a doorway.
Use span and palette to reveal small faults
Many engineers leave the camera in auto mode and start scanning. That's quick, but it often hides the fault. Auto mode chases the hottest and coldest points in the frame. If one hot exhaust casing or motor terminal enters the image, the whole scale shifts and your subtle hydraulic anomaly disappears into a broad colour band.
Manual range selection is usually better when checking:
- Pump casing uniformity
- Valve-by-valve comparisons on a manifold
- Filter inlet and outlet patterns
- Cooler face consistency
- Cylinder gland and barrel heating
A narrower span helps you see smaller differences. The trick is not to over-tighten the span so far that normal variation looks dramatic.
For a useful visual explanation of setup and inspection technique, this walkthrough is worth watching before you head onto the plant floor.
Calibrate against reality, not colour alone
Colour palettes are for interpretation. They are not the measurement. A white or red area in the image doesn't automatically mean failure. It only means that part is hotter relative to the chosen scale.
Check three things every time:
| Check | Why it matters | What to watch for |
|---|---|---|
| Surface type | Surface finish changes infrared behaviour | Bare polished metal can misread badly |
| Load condition | Heat without load context tells you little | Compare under similar duty |
| Background influence | Reflections create false hot spots | Nearby motors, heaters, sunlit panels |
When the camera is set properly, the image stops being a pretty picture and becomes a reliable inspection tool.
Executing the Thermal Scan A Systematic Approach
A thermal scan works best when you follow the hydraulic circuit in order rather than jumping straight to the part you suspect. On a power pack, that means starting at the drive end, moving through the pump and control section, then following the fluid path through filters, coolers, actuators and back to tank.
That sequence matters because heat travels with the fault story. If you only scan the valve bank, you may miss that the underlying issue began at the pump or in the return circuit.
Establish a baseline before chasing faults
Begin with the system running under its normal, stable operating condition. Not start-up. Not a temporary peak. Normal duty. Capture a visual image and thermal image of the major components while the machine is behaving as expected, or at least as close to expected as the fault allows.
The baseline should include:
- Prime mover area
- Pump body and mounting
- Main pressure line
- Valve manifold
- Actuator connections
- Return filtration
- Cooler and return-to-tank line
- Reservoir surface and suction zone
This first pass tells you what the machine considers normal on that day. Without it, every later image is judged from memory, and memory is poor evidence.
Scan under load in a fixed order
Once the baseline is captured, run the machine through the condition that tends to produce the complaint. On a press, that might be full working pressure. On mobile kit, it may be repetitive lifting or steering under resistance. On a production line, it may be the period when the oil reaches working temperature and the lag starts.
I prefer to work in one direction and keep the same order each time:
- Motor and coupling
- Pump inlet and outlet zones
- Pressure line transitions
- Relief and control valve areas
- Actuator ports
- Return line, filter and cooler
- Tank and breather area
That repeatable path makes comparison easier on later inspections.
If the machine fault appears after warm-up, don't scan only once. Scan at consistent intervals through the heat build-up period and compare the progression.
Focus, angle and distance matter
Hydraulic equipment is full of reflective surfaces. You can ruin a scan by standing in the wrong place. Keep the camera as perpendicular to the target surface as practical. A glancing angle increases reflection and reduces confidence in the reading. The same principle is stressed in thermographic surveying practice for reducing emissivity errors and reflection artefacts, especially on metal components, as noted earlier.
Distance matters too. Too far away and you lose useful detail. Too close and you may only see part of the story. On a valve bank, for example, it's often better to capture the whole section first, then close in on suspect cartridges or subplates.
What a typical pass looks like on a power pack
On a compact industrial power pack, the first anomaly may show at the pump rear housing. If the body temperature rises unevenly around one side of the casing while the outlet line temperature also climbs, I'd start thinking about internal wear, bypassing or friction. If the relief valve branch is noticeably warmer than expected during ordinary duty, I'd question whether fluid is being dumped across relief more often than the operator realises.
On the return side, a filter with an unusual thermal pattern can suggest restriction. A cooler face that isn't showing a sensible distribution may point to fouling, poor airflow, or reduced fluid movement. The reservoir itself can add context. If the tank temperature is steadily rising but the cooler contribution looks weak, the fault may be less about load and more about heat rejection.
Capture enough context for later analysis
Don't fill the report with isolated close-ups that nobody can place. For each suspect area, save:
- A normal digital image
- A wider thermal image showing context
- A tighter thermal image of the anomaly
- Load condition at the time
- Any operator observation linked to that moment
That combination lets someone else review the finding without standing beside the machine. It also stops the common argument a week later when people ask whether the image was from the pump, the manifold, or the line behind it.
Decoding Thermal Signatures in Hydraulic Components
Thermal cameras don't see through steel, aluminium or cast iron. They detect surface temperature variations. That distinction matters because one of the most persistent misconceptions in maintenance is that a thermal camera can look inside a hydraulic casing and reveal the exact failed part.
It can't.
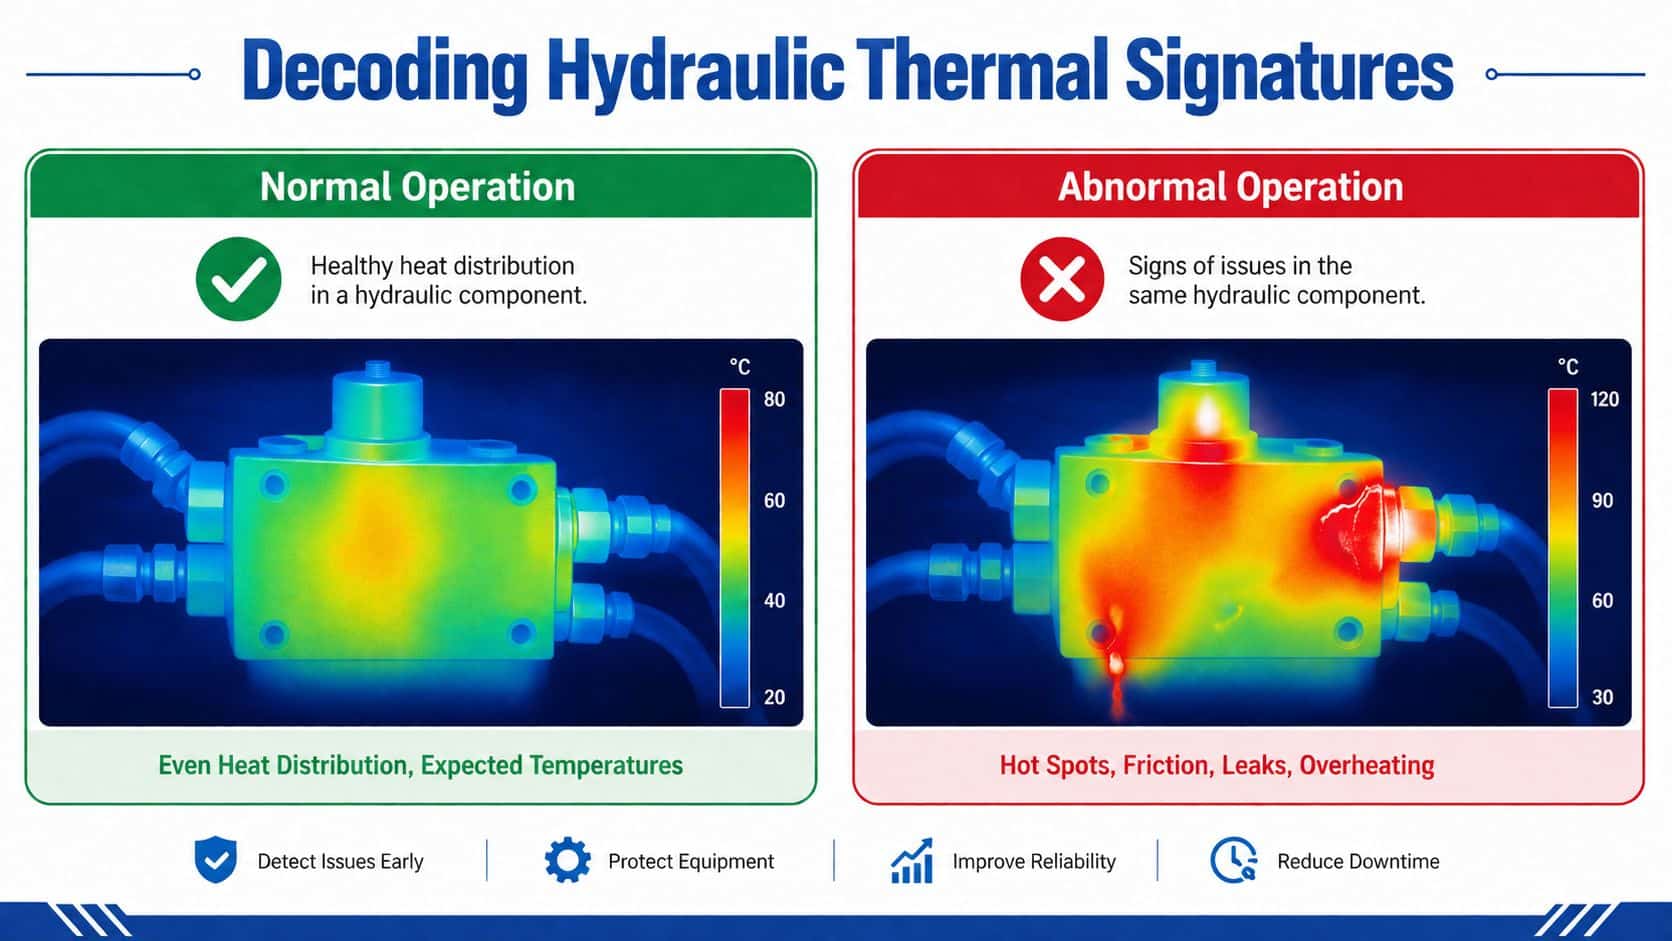
A thermal camera shows the external heat effect of what's happening inside. According to Process Parameters on whether thermal cameras can see through walls, thermal cameras only detect surface temperature variations, and relying on thermal imaging alone creates a false negative risk where 30–40% of internal hydraulic inefficiencies, such as slow-flow valve sticking, remain undetected until catastrophic failure. That is why thermal imaging should guide follow-up testing, not replace it.
Read patterns, not just peak temperature
The most useful hydraulic scans come from comparing distribution, concentration and change over time.
A single hot point may matter. But in many cases, the better clue is an unexpected pattern. A relief valve body that is consistently warmer than neighbouring valves during normal operation. A cylinder gland heating more than the barrel during repeated holding. A pressure line fitting running hotter than the hose either side. Those patterns point to energy loss.
Common Hydraulic Faults and Their Thermal Signatures
| Component | Thermal Signature | Probable Cause |
|---|---|---|
| Gear pump | Localised casing hot spot or uneven body temperature | Internal leakage, wear, friction, possible cavitation-related stress |
| Relief valve | Body or outlet path hotter than expected during ordinary duty | Fluid bypassing across relief, valve not seating properly, setting issue |
| Directional valve section | One station warmer than adjacent sections under similar use | Spool sticking, leakage path, abnormal flow through one function |
| Hydraulic motor | Heat concentrated at one end or around case drain area | Internal wear, leakage, loading issue, return restriction |
| Cylinder gland | Gland area heating faster than barrel in repeated cycles | Seal friction, side loading, contamination, internal leakage effects |
| Hose or rigid line | Hot fitting or short hot section with cooler pipe either side | Restriction, partial blockage, poor connection, local turbulence |
| Filter housing | Abnormal temperature difference across the housing pattern | Restriction building, reduced flow, bypass condition |
| Oil cooler | Uneven face temperature or weak cooling pattern through the circuit | Fouling, poor airflow, low fluid flow, cooling inefficiency |
| Reservoir | General temperature rise not matched by expected cooling response | Excessive system losses, poor cooler performance, constant bypassing |
That table is a starting point, not a diagnosis sheet. The same thermal signature can have more than one cause. A hot pump may be worn, misaligned, starved at the inlet, or doing hard work in poor cooling conditions. Context decides which explanation survives.
What works well in real fault-finding
Three comparisons usually give the clearest answers:
- Like-for-like comparison: Compare one valve station with another doing similar work.
- Before-and-after comparison: Scan before load and after a repeatable duty period.
- Upstream-and-downstream comparison: Follow the temperature change across filters, coolers and suspect restrictions.
In this context, hydraulic diagnosis proves much stronger than generic building or electrical scanning. You're not just hunting for hot spots. You're tracing energy loss through the fluid path.
A practical example is cooler assessment. If return oil remains hot and the cooler face pattern looks patchy, the issue may be in the cooling arrangement itself. If cooling performance is a recurring design concern, reviewing broader hydraulic cooling system design considerations can help determine whether the problem is condition-related or built into the system layout.
A thermal anomaly is a direction of travel. Pressure checks, flow testing, case drain checks and oil analysis decide the final diagnosis.
What thermal imaging won't tell you on its own
Thermal imaging is weak at proving some internal hydraulic faults when there's little surface consequence. A sticky valve may behave badly without generating a strong external pattern. A slowly deteriorating seal can hide until leakage increases enough to alter surface temperature. Fluid contamination may be causing wear long before the heat signature becomes obvious.
That's why the best maintenance teams use thermal imaging as part of a stack:
- Thermal scan to identify suspect zones.
- Pressure and flow checks to confirm hydraulic performance.
- Visual inspection for leakage, chafing, looseness and contamination.
- Trend comparison against earlier reports.
- Strip inspection only when the evidence justifies downtime.
Used this way, thermal imaging saves time because it sharpens the next decision instead of pretending to be the only decision.
Creating Actionable Reports for Preventive Maintenance
A thermal scan that lives in the camera gallery has almost no maintenance value. The report is what turns observation into action. If a fitter, supervisor and planner can't all read it and agree on the next step, the inspection wasn't finished.
That matters even more on hydraulic systems, because many findings are not instant shutdown faults. They are developing conditions. The report needs to show why the issue matters and what should happen next.

Build every report around comparison
Under NFPA 70B Section 7.4.1, thermography inspections must measure the temperature difference, or ΔT, of similar electrical components under similar loading conditions. Section 7.4.3 requires all temperature differences between the area of concern and a reference area to be formally documented (FLIR summary of NFPA 70B thermography requirements). Although that standard is written around electrical thermography, the reporting discipline is highly useful in hydraulic work too.
In plain terms, don't just write “valve hot”. Write what it was hotter than, under what load, and why that difference matters.
What to include in a hydraulic thermal report
A report should be brief enough to use on the shop floor and detailed enough to support planning. I'd include:
- Asset identification: Machine, power pack, circuit section, date and operating condition.
- Visual photograph: So the reader knows exactly what was scanned.
- Thermal image: With measurement points or areas clearly marked.
- Reference comparison: Similar component, adjacent component, or earlier baseline.
- Observed condition: What the image suggests in practical language.
- Recommended action: Monitor, schedule repair, or immediate investigation.
- Supporting notes: Operator complaint, ambient conditions, duty cycle, known recent repairs.
A simple severity model that actually gets used
Not every anomaly deserves the same response. A good report tells the planner what to do next.
| Severity | Meaning | Typical response |
|---|---|---|
| Monitor | Anomaly present but stable enough to trend | Reinspect at next planned interval and compare |
| Schedule repair | Fault likely developing and should be addressed in planned downtime | Order parts, prepare labour, define scope |
| Immediate action | Condition may compromise safety or cause imminent failure | Escalate, isolate if required, inspect without delay |
This format works because it speaks the language of maintenance planning rather than thermography theory.
Reporting rule: If the next action isn't obvious from the report, rewrite the report.
Make photo management painless
Documentation quality drops quickly when engineers are forced to rename files by hand and piece together folders later. If your team struggles to keep photos, thermal images and notes tied to the right asset, a field documentation workflow such as OnRoute for photo management is worth reviewing. It's a practical example of how teams keep image records usable after the inspection is over.
For planned maintenance, thermal findings should also feed directly into your existing preventive maintenance plans. That way, a warm relief valve today becomes a scheduled valve inspection, parts check, and verification task. It doesn't disappear into someone's camera roll.
Write for the next person, not for yourself
The engineer who took the image usually remembers the context. The planner reading it three days later doesn't. Write so a different person can understand the asset condition without standing beside you.
Good reports answer these questions fast:
- What was inspected?
- What was abnormal?
- Compared with what?
- How urgent is it?
- What should happen next?
If your report does those five things consistently, thermal imaging becomes part of preventive maintenance rather than a collection of interesting pictures.
Integrate Thermal Imaging into Your Maintenance Strategy
Reactive hydraulic maintenance is expensive because the first failed part is rarely the only casualty. A worn pump sheds debris. A bypassing valve overheats the oil. Hot oil shortens seal life elsewhere in the system. By the time production stops, the repair scope has grown.
Regular thermal imaging inspection changes that pattern. It helps maintenance teams spot developing losses while the system is still running, still testable and still repairable in a controlled window. This is the primary benefit. Not novelty, not colourful images. Better timing.
The strongest programmes don't treat thermography as a standalone event. They combine it with pressure checks, flow verification, operator feedback and maintenance history. Over time, that gives you trend data on the machines that matter most, from mobile plant to fixed industrial power packs.
Even when looking outside heavy industry, there's a lesson in specialist equipment choice and application fit. A buying guide such as choosing HIKMICRO for SA veld shows the same principle in a different setting. Match the tool to the environment and the job becomes easier. Get that choice wrong and even a good operator will fight the equipment.
Thermal imaging won't replace hydraulic knowledge. It rewards it. The engineers who get the most from it are the ones who understand how heat, flow, pressure and load relate to each other inside a working circuit.
If you want practical advice on hydraulic fault-finding, component selection, bespoke power packs or preventive maintenance support, speak to MA Hydraulics Ltd. Phone 01724 279508 today, or send us a message.
