
A lot of teams are in the same position right now. The lab report has landed in your inbox. It shows a few values drifting the wrong way, the machine is still running, production wants it left alone, and nobody wants to pull a pump or drain a tank on a hunch.
That's where most oil analysis programmes succeed or fail. Taking a sample is the easy part. Filing the report is easy too. The difficult part is deciding what the numbers mean, who owns the decision, and what action happens before a minor hydraulic issue becomes an outage.
Why Proactive Oil Analysis Matters
The report lands in your inbox on a Tuesday morning. Particle count is up, viscosity has started to drift, and production still wants the machine left in service until the weekend. That point, between seeing a problem on paper and deciding what to do on the plant floor, is where oil analysis programmes either prevent failures or turn into admin.
Proactive oil analysis gives maintenance teams time to act while the asset is still running and the repair can still be planned. In hydraulic systems, that window is often the difference between a filter change and contamination investigation, or a pump failure that sends debris through the whole circuit.
Oil condition also shows what routine inspections miss. A sight glass will not show early-stage wear debris, moisture at a level that shortens component life, or the gradual loss of additive performance. By the time the oil looks obviously wrong, the machine is often well past the cheapest intervention point.
This is especially important on UK industrial sites where shutdown windows are tight and maintenance decisions are often delayed until there is no choice left. A lab report on its own does not protect a press, power unit, or mobile machine. A report linked to clear limits, named ownership, and a defined response does.
For hydraulic systems, oil analysis should sit alongside cleanliness control, not apart from it. If the plant already works to hydraulic fluid cleanliness standards, routine sampling shows whether those targets are maintained in service, after top-ups, filter changes, hose work, and contractor intervention.
Practical rule: If a machine is critical enough to stop production when it fails, it is critical enough to sample and trend.
The return is usually straightforward. Planned filter changes cost less than pump rebuilds. Finding a breather, seal, or filling practice that is letting dirt in costs less than flushing a contaminated system. The value comes from acting early and acting on the right fault, not from collecting reports that nobody turns into a maintenance decision.
What Key Oil Analysis Tests Reveal
A report has value only if it points to a clear maintenance decision. In practice, the key tests answer three questions. Is the oil still fit to run. Has contamination entered the system. Are components starting to wear in a way that identifies a developing fault.
Those are different failure paths, so they need different responses. Viscosity drift can point to overheating, oxidation, dilution, or the wrong top-up oil. A poor cleanliness result usually sends the team toward filtration, breathers, transfer practices, or ingress points. Rising wear metals shift the job again. The focus becomes which component is shedding material, how fast, and whether the machine can stay in service until the next planned stop.
Fluid condition tests
Fluid condition tests check whether the oil can still do its job under load and temperature. Viscosity is the starting point. If it moves too far from the new oil baseline, pumps lose film strength, internal leakage rises, and valve behaviour can become less predictable. On a hydraulic press or power unit, that often shows up as sluggish response, lost efficiency, or heat.
Acid number and additive condition help separate an old-oil problem from a contamination problem. If oxidation is building and reserve additives are depleted, changing filters will not solve the root issue. The oil itself has aged out. In UK plants, this is a common point of delay. The lab flags degraded oil, but no one wants to authorise a change until the machine is already running hot or erratic.
Contamination tests
Contamination tests show what has entered the system from outside, from process contact, or from poor handling. Water is a regular offender. Even low levels can shorten additive life, promote corrosion, and reduce lubricity long before operators see a milky appearance in the tank. If the sample shows water, the next question is practical, not theoretical. Did it come through a failed cooler, poor storage, washdown, condensation, or the wrong transfer container?
Solid contamination is often the test that drives the fastest action. Dirt damages clearances first and asks questions later. For hydraulic systems with servo valves, proportional valves, or tight-tolerance piston pumps, the cleanliness result often decides whether the maintenance team changes a filter, checks a breather, inspects recent hose work, or audits filling practices. For more on interpreting cleanliness codes and thresholds, see this guide to hydraulic oil particle counting.
Wear debris tests
Wear debris testing helps bridge the gap between a report and a repair plan. Iron, copper, aluminium, chromium, lead, and silicon each mean more when they are tied back to the machine bill of materials and the recent maintenance history. Iron may suggest gear, shaft, or cylinder wear. Copper or bronze can point toward bushes, cages, or thrust surfaces. Silicon often pushes the investigation toward dirt ingress rather than internal wear alone.
Trend matters more than one isolated result. A single high metal can come from a transient event or a recent repair. A steady rise across two or three samples is harder to dismiss and far more useful for planning. Consequently, many sites lose time. The lab report lands, the numbers are noted, and nothing happens until vibration, heat, or poor performance forces the issue. A better approach is to agree in advance what rise in wear metals triggers inspection, borescope work, filter strip analysis, or a scheduled outage.
| Test Method | What It Detects | Typical Maintenance Use |
|---|---|---|
| Viscosity at 40°C | Thickening, thinning, oxidation, dilution, wrong oil mix | Decide whether the oil can remain in service or needs changing |
| Acid number or additive condition | Oxidation, additive depletion, loss of reserve protection | Confirm whether the problem is aged oil rather than filtration alone |
| Water content | Dissolved or free water, corrosion risk, reduced lubricity | Check coolers, storage, breathers, washdown exposure, and handling |
| Elemental analysis | Wear metals and contamination markers | Link metal types to likely components and set inspection priority |
| Particle count | Cleanliness level and filter control | Review filters, ingress points, transfer practices, and recent maintenance work |
A useful report narrows the job. Change the oil. Dry it. Clean it. Inspect a pump. Strip a valve. Bring a shutdown forward.
That is the standard to aim for. If the result does not lead to a named action, an owner, and a timescale, the testing has identified a problem but the site has not controlled it.
Correct Sampling for Accurate Results
A technician pulls a bottle from a drain point at the end of shift, sends it to the lab, and gets a report that shows high dirt and water. Two days later, maintenance changes filters and starts planning a shutdown. Then the next sample comes back clean. The first sample was bad, not the machine.
That gap between report and action often starts here. If the sample is not representative, every decision that follows is weaker. In UK plants, I see this repeatedly. Teams pay for testing, get a report, and still lose time because the sample was taken from the wrong point, at the wrong time, or with poor handling.
Where to sample
Take the sample from a live point in the circuit where oil is flowing and well mixed. A dedicated sampling port on the pressure side, return line, or a properly chosen minimess point usually gives a far better result than a tank drain or the bottom of a reservoir. Dead legs, drain taps, and catch points collect settled debris and water. They are useful for checking what has dropped out of suspension, but they are poor choices for routine condition trending.
Timing matters as much as location. Sample with the machine at normal operating temperature and under stable conditions where possible. A sample taken after a long shutdown can under-report circulating debris or overstate settled contamination, depending on where it is drawn.
If a critical asset has no proper sample point, fit one. The cost is small compared with the cost of one false diagnosis.
How to collect it properly
Use a clean, sealed bottle from the lab. Clean the outside of the port before opening it. Purge the line or valve first so stale oil does not distort the result, then collect the sample without touching the inside of the cap or bottle. Fill the bottle to the lab's marked range or standard sample level, leaving enough headspace for handling and testing.
Small lapses cause expensive confusion. I have seen dirty gloves, uncapped bottles on a workbench, and samples left in vans for days before dispatch. Each one can create a report that points the team towards the wrong fault.
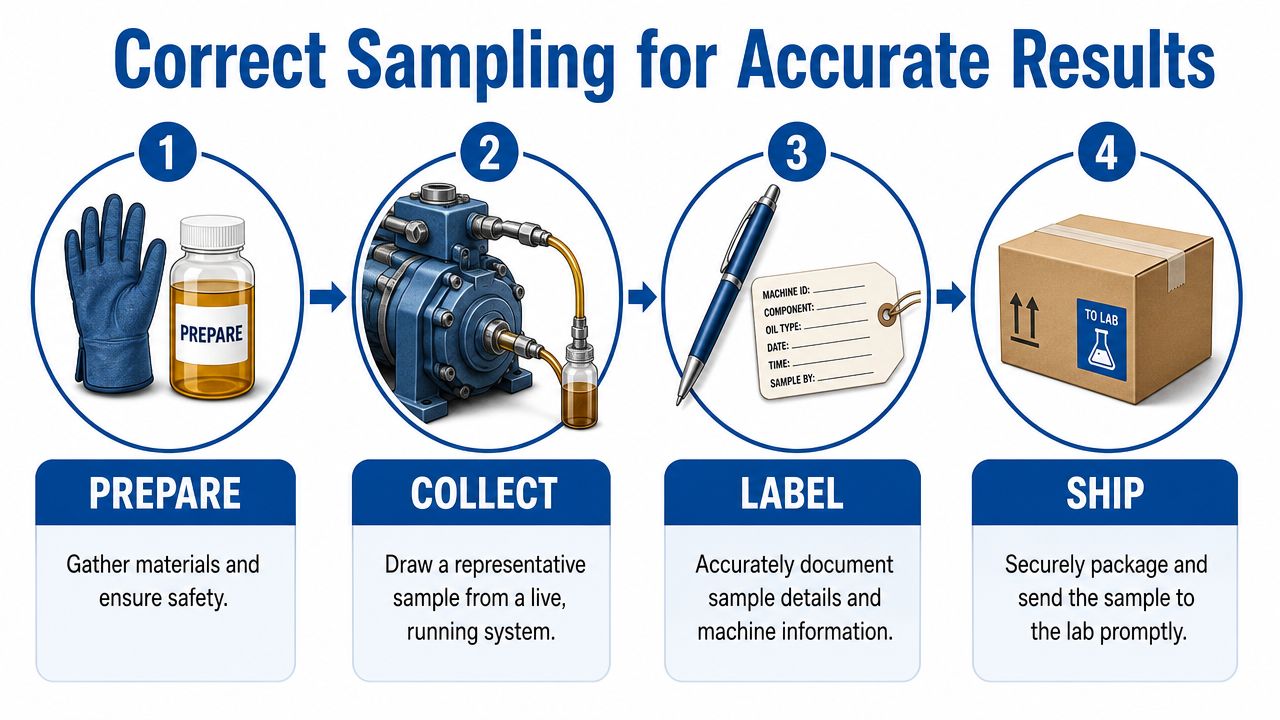
A workable routine looks like this:
- Prepare before opening the port. Have the bottle, labels, wipes, gloves, and machine details ready.
- Draw from the same point each time. Trend quality depends on consistency.
- Record the machine condition. Note running hours, oil grade, load, temperature, and any recent filter, cooler, or component work.
- Seal and ship promptly. Old samples oxidise, cool down, and separate. That changes what the lab sees.
For sites that keep finding moisture in hydraulic systems, this guide to water contamination detection in hydraulic oil helps when choosing sample points and checks around breathers, coolers, storage, and washdown exposure.
If procedures are buried in old manuals, teams can speed up review by extracting text, tables, and images from PDFs and turning them into a clear sampling standard for the shop floor.
A quick visual summary helps when training technicians on the shop floor.
Setting the sampling interval
Set the interval by asset criticality, operating conditions, and failure consequence. Monthly sampling may be justified on heavily loaded hydraulic power units, systems with known ingression risks, or machines where one valve or pump failure stops production. Less critical and stable systems can often be sampled less often, provided the interval stays consistent enough to show a trend.
Water limits and action limits should also come from the machine, not from a generic rule copied across the site. OEM guidance, fluid supplier limits, cleanliness targets, and the component sensitivity of servo valves, proportional valves, and piston pumps all affect what is acceptable. A system with fine-control hydraulics usually needs tighter control than a simple low-duty power pack.
The aim is simple. Build a repeatable sampling routine that gives the lab a trustworthy sample, so the report leads to the right maintenance action without delay.
Decoding the Report From Data to Diagnosis
The report lands in the inbox on Tuesday morning. Particle count is up, iron has edged higher, and someone writes “monitor” in the CMMS. By Friday, the machine is still running, nobody has checked what changed on the asset, and the next useful decision gets pushed to the next shutdown meeting. That gap between report and action is where many oil analysis programmes lose their value.
Trends beat snapshots
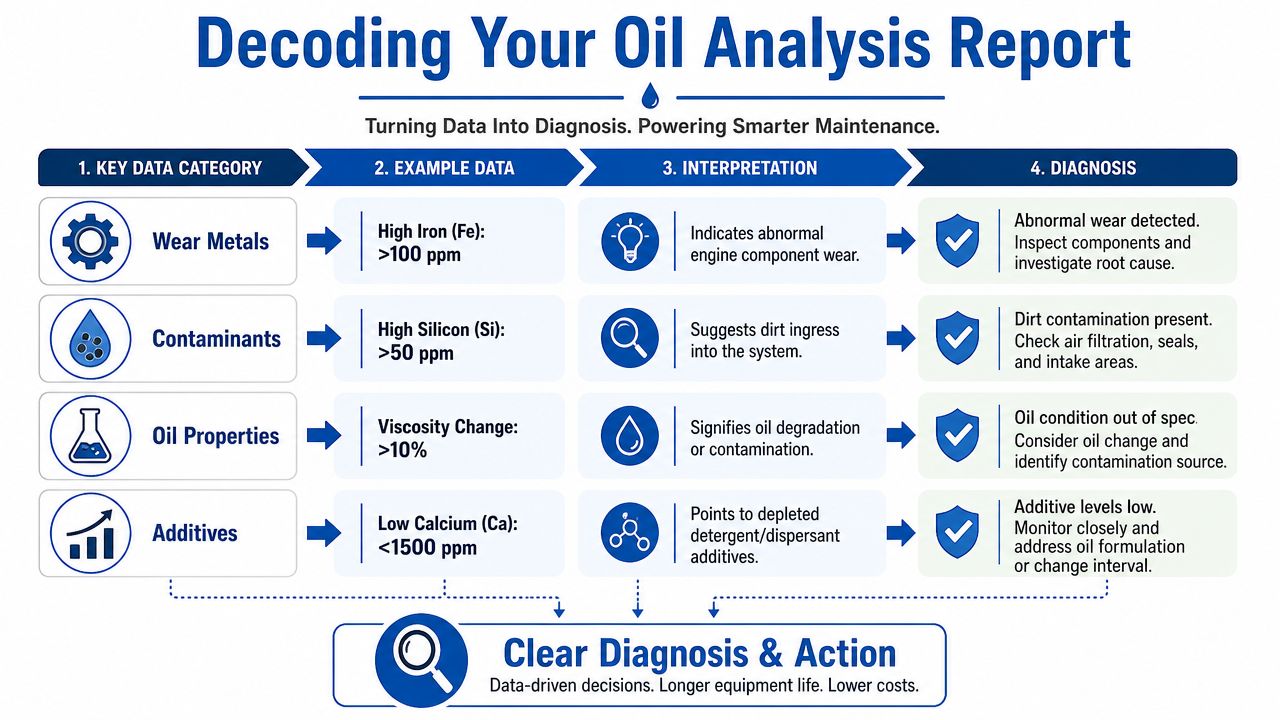
Start with the trend, not the red or amber marker on a single page. One result outside a lab limit can come from a top-up, a recent filter change, a period of abnormal duty, or a poor sample. A trend across two or three consistent samples carries more weight because it shows direction and rate of change.
Ask three questions before raising work:
- What changed since the last sample
- How fast it changed
- What work, event, or operating condition changed with it
That is how a report turns into diagnosis instead of noise.
A rising iron level means something different if the return filter was changed last week, if the pump has been cavitating, or if the unit has just come back from overhaul. Water after cooler work points to one set of checks. Water after outdoor storage points to another. The numbers only become useful when they are tied to the machine history, operator comments, and maintenance records.
Numbers without context create false urgency. Trends with machine history create decisions.
Reading the common hydraulic signatures
Read the report in layers. Begin with the condition of the oil itself, then move to contamination, then to wear metals, and finally to anything that suggests a specific failure mode.
Viscosity drifting away from the new oil baseline usually points to oxidation, thermal stress, fuel or solvent contamination in some systems, or the wrong make-up oil. If viscosity has moved and other signs of fluid ageing are also worsening, plan for an oil change and find the cause before the replacement charge degrades in the same way. If viscosity moves while the rest of the package looks steady, check what has been added to the tank and whether the sample was representative.
Next, look at cleanliness and water. A worsening particle count with stable wear metals often points to ingression or poor contamination control before it points to internal damage. Water is never a result to leave sitting in the report queue. In UK plants, I often see delay here because the assumption is that the next sample will confirm it. Meanwhile the fluid keeps circulating through valves, pumps, and bearings. If water is present, inspect breathers, coolers, seals, reservoir covers, and storage practices straight away.
Then review wear metals in the context of machine construction. Iron rising over several samples usually indicates developing ferrous wear. Copper or bronze can suggest distress in bushes, thrust washers, or bearing surfaces, but only if those materials are present in the machine. Glycol contamination needs immediate attention because it often points to cooler leakage and can damage lubricity quickly.
| Report pattern | Likely meaning | First maintenance response |
|---|---|---|
| Viscosity out of range, wear stable | Fluid degradation or wrong oil | Verify oil identity, check heat load, plan oil change |
| Water present, particle count worsening | Moisture ingress and contamination control problem | Inspect breathers, coolers, seals, and tank condition |
| Iron rising across multiple samples | Developing ferrous wear | Inspect pump, motor, gearbox, or cylinder wear surfaces |
| Copper or bronze rising | Bush or bearing distress | Check components that contain non-ferrous wear surfaces |
If reports arrive as PDFs and values need to be compared across long histories or multiple assets, extracting text, tables, and images from PDFs can speed up trend review and reduce manual re-keying. This is particularly useful when the lab format changes between reports.
Turning diagnosis into a job plan
A good report review ends with a named action, an owner, and a deadline. Continue in service and resample on a defined date. Change filters and inspect the return line. Isolate and pressure test the cooler. Book a pump inspection at the next planned stop. Those are decisions.
“Monitor” is not a decision unless it includes a resample date, a trigger point, and responsibility for review.
This is the step many sites miss. The lab has done its part. The failure still happens because nobody translated the report into a maintenance instruction quickly enough. Close that gap, and oil analysis starts paying for itself in the way it should.
The Business Case ROI and Real-World Examples
The return on oil analysis rarely comes from the lab fee alone. It comes from avoiding the expensive chain of events that follows an unplanned hydraulic failure. That chain usually includes downtime, emergency labour, secondary contamination, rushed parts sourcing, and lost production while everyone waits for the machine to come back.
You don't need an elaborate financial model to make the case internally. Compare the cost of planned intervention against the cost of an uncontrolled stop. In most plants, the argument becomes obvious once operations, maintenance, and procurement put real local costs beside each option.
A practical ROI view
Use a simple framework:
- Cost of monitoring. Sampling materials, lab testing, technician time, and report review.
- Cost of planned work. Filters, oil, seals, labour, and a booked maintenance window.
- Cost of failure. Production loss, contamination clean-up, overtime, damaged components, and expedited delivery.
For teams that want a quick way to structure that comparison, a BuddyPro ROI calculator can help organise the inputs and show the difference between planned and reactive spend.
What usually works and what doesn't
What works is targeting critical assets first. Presses, mobile hydraulic packs, machines with proportional valve banks, and systems with expensive pumps usually justify a formal programme quickly. What doesn't work is blanket sampling of everything without any plan for action. That creates paperwork, not value.
Another trade-off is whether to change oil by time alone or condition. Time-based changes feel simple, but they can waste usable oil in one machine while leaving another in service too long. Condition-based maintenance is usually more defensible, provided sampling and interpretation are consistent.
Commercial reality: The value of oil analysis appears when it prevents disruption, not when it produces a tidy spreadsheet.
The strongest business case also includes credibility. If engineering can show that the programme leads to scheduled repairs, cleaner systems, and fewer surprise failures, management stops seeing oil analysis as a laboratory exercise and starts seeing it as asset protection.
Closing the Loop From Report to Repair
Many programmes often fail at this point in the process. The sample is taken. The lab report arrives. Someone reads it. Then it sits in an inbox because production is busy, maintenance is stretched, and nobody has agreed what happens next.
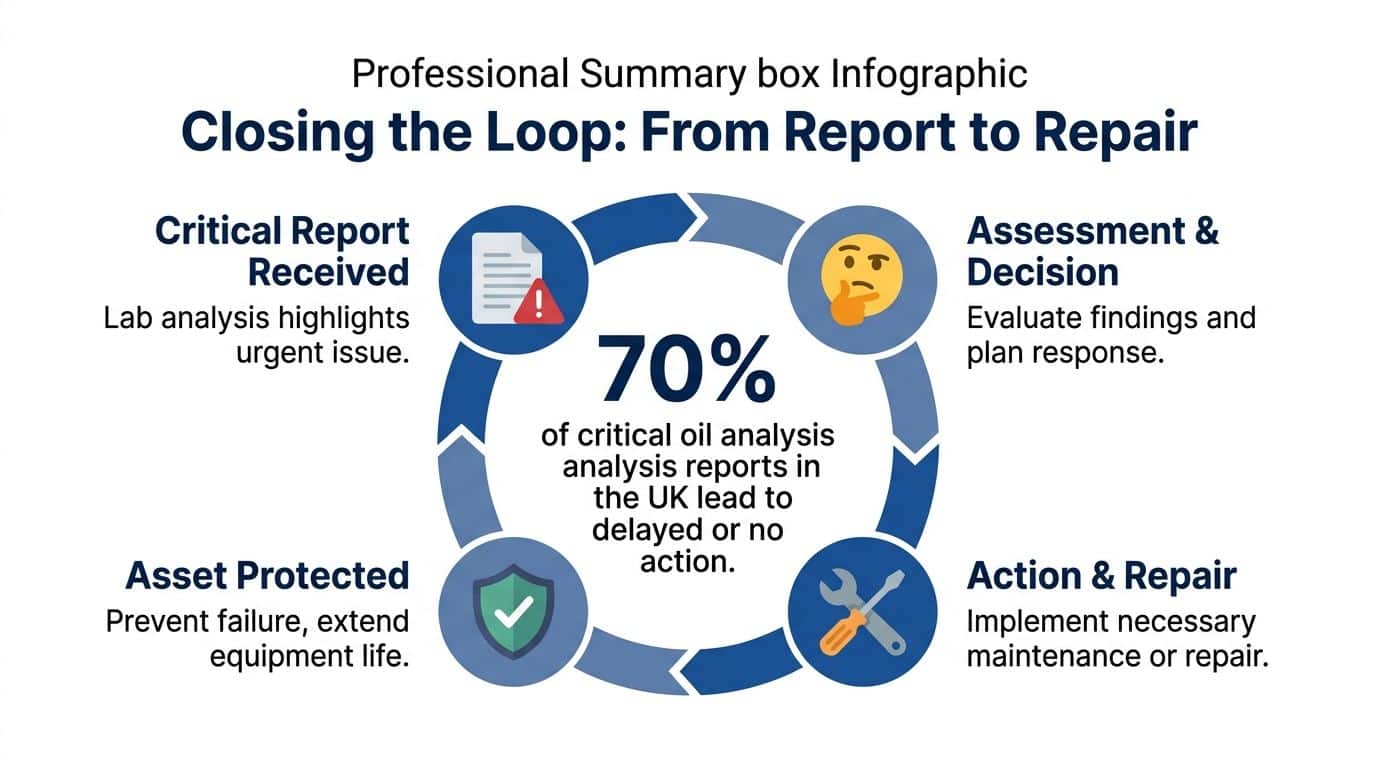
The gap is real. While 87% of UK industrial firms conduct oil analysis, only 34% consistently follow up with corrective maintenance within 7 days. This disconnect costs some hydraulics users an average of £12,500 per incident annually due to preventable failures according to this discussion of oil analysis workflow failures.
A workable response system
The fix isn't complicated. It needs ownership and a standard response. Most sites do well with a simple traffic-light model tied to named actions.
- Green means continue running and sample again at the normal interval.
- Amber means review by engineering, define checks, and bring the next sample forward.
- Red means raise a maintenance job immediately and decide whether to inspect, isolate, or replace.
That only works if one person owns report review. It can be a reliability engineer, maintenance manager, or senior fitter, but it must be explicit. Shared ownership usually means no ownership.
Build the hand-off into the process
Create a short SOP for critical reports. It doesn't need to be elaborate. It needs to answer these points clearly:
- Who reviews the report on the day it arrives
- What values trigger escalation
- Which component checks follow each alert type
- Who raises the work order
- When the machine is resampled after intervention
A red-flag wear report without a job number attached to it is unfinished work.
If you want oil analysis to prevent failures, the lab result has to trigger action in the CMMS, parts planning, and workshop schedule. That is the essential programme. Sampling is just the front end.
Partnering for Success Your Next Steps
A report lands on Friday afternoon showing rising copper and silicon on a press that has to run through the weekend. The sample has been taken correctly, the lab has done its job, and the trend is clear. The point where many programmes still fail is the hand-off from report to maintenance action.
A successful oil analysis programme needs a practical support structure around it. That means clear technical interpretation, access to machine history, and a realistic plan for inspection, parts, and downtime. In UK plants, the delay often starts after the diagnosis. The report is understood, but nobody decides whether to inspect now, order parts first, or run to the next planned stop. That gap is where preventable failures slip through.
Some sites use an independent lab and manage the engineering response in-house. That works well if the person reviewing reports knows the machine population, common failure modes, and lead times for replacement components. Other sites prefer outside support that can help connect wear findings to likely faults and the parts needed to fix them. MA Hydraulics Ltd is one option for hydraulic fluid analysis, component support, and access to items such as Vivoil pumps, OMT filters, valves, gear motors, and bespoke power pack hardware when a lab result has to become a repair plan.
The next step is straightforward. Review how your site handles the period between receiving a report and raising work. If that hand-off depends on emails, memory, or whoever is on shift, tighten it. Set response times for amber and red results, define who can approve inspection or parts spend, and make sure the team can move from lab comment to booked maintenance task without delay.
If you want help building a practical oil analysis programme for hydraulic systems, contact MA Hydraulics Ltd. Phone 01724 279508 today, or send us a message.
