
You're usually not looking at a pump curve out of curiosity. You're looking at it because something on the machine isn't right.
The actuator is slower than expected. The oil is running hotter than it should. A replacement pump with the “same” displacement doesn't behave like the one it replaced. On mobile equipment, the problem often gets worse because the machine never runs at one fixed speed for long, so the neat catalogue figure you started with doesn't match what happens in the field.
That's where people get caught out. They match headline flow and pressure figures, fit the pump, and assume the rest will sort itself out. It won't. A pump only makes sense when you read its curve against the system it's feeding, the speed it runs at, and the operating window you expect it to live in.
For anyone working with hydraulic gear pumps in UK mobile plant, industrial machinery, or power packs, learning how to read pump curves isn't academic. It's one of the fastest ways to avoid wasted power, nuisance failures, and poor machine response.
Why Pump Curves Are Your Most Important Tool
A site fitter swaps a worn gear pump on a tipping trailer or compact power pack, matches the displacement on the nameplate, starts the machine, and still ends up with slow movement, hot oil, or a relief valve chattering sooner than expected. That is a pump-curve problem, not a parts problem.
Pump curves turn pump selection from assumption into engineering. For hydraulic gear pumps used across UK mobile plant and industrial systems, they show what the pump can deliver under actual operating conditions, not just the tidy catalogue figure taken at one speed, one viscosity, and one test setup.
The common mistake on working machines
In practice, the error is usually straightforward. A maintenance team wants faster cycle times, so attention goes straight to litres per minute. A machine builder wants more actuator force, so the discussion jumps straight to pressure. On a real hydraulic system, neither number stands on its own.
Flow, pressure, shaft power, volumetric efficiency, mechanical efficiency, oil temperature, suction condition, and system resistance all move together. The pump curve is the sheet that ties those relationships into one view. That basic QH relationship lets you judge how a pump will behave under load instead of relying on a best-case assumption.
Practical rule: If you have not plotted the duty point, you have not selected the pump.
That sounds blunt because it needs to be. This is a common point of failure in pump selection, especially where replacement decisions are made quickly from displacement and maximum pressure alone.
Why headline ratings are not enough
A gear pump can look suitable on paper and still be wrong for the job. The usual reasons are predictable. The required duty point sits outside the useful part of the curve. The published curve is based on a speed the machine rarely holds. The oil in service is hotter or thinner than the oil used for the test data. Suction losses from pipework, strainers, or a tired inlet arrangement are ignored.
Those issues show up regularly on mobile equipment in the UK because operating conditions drift all day. Engine speed rises and falls. Cold-start viscosity is very different from hot running viscosity. Return filtration loads up over time. Directional valves and hoses add pressure loss that never appears in the headline pump rating.
A good curve lets you see those trade-offs before they become heat, noise, and short component life.
It also saves time in fault-finding. If a machine is sluggish, noisy, or running hotter after a pump change, I would check the curve before changing another component. In many cases, the problem is not that the pump is defective. It is that the selected pump only matches one number in the specification and misses the operating window the machine operates in.
Decoding the Key Lines on a Pump Performance Curve
A maintenance manager has a machine that feels slow when hot but looks fine on the spec sheet. The pump displacement matches. The pressure rating matches. The problem usually shows up when you read the curve properly, especially with hydraulic gear pumps used on UK mobile and industrial equipment, where speed, oil temperature, and real system losses move around through the day.
Start with the two axes
Read the axes before reading the pump.
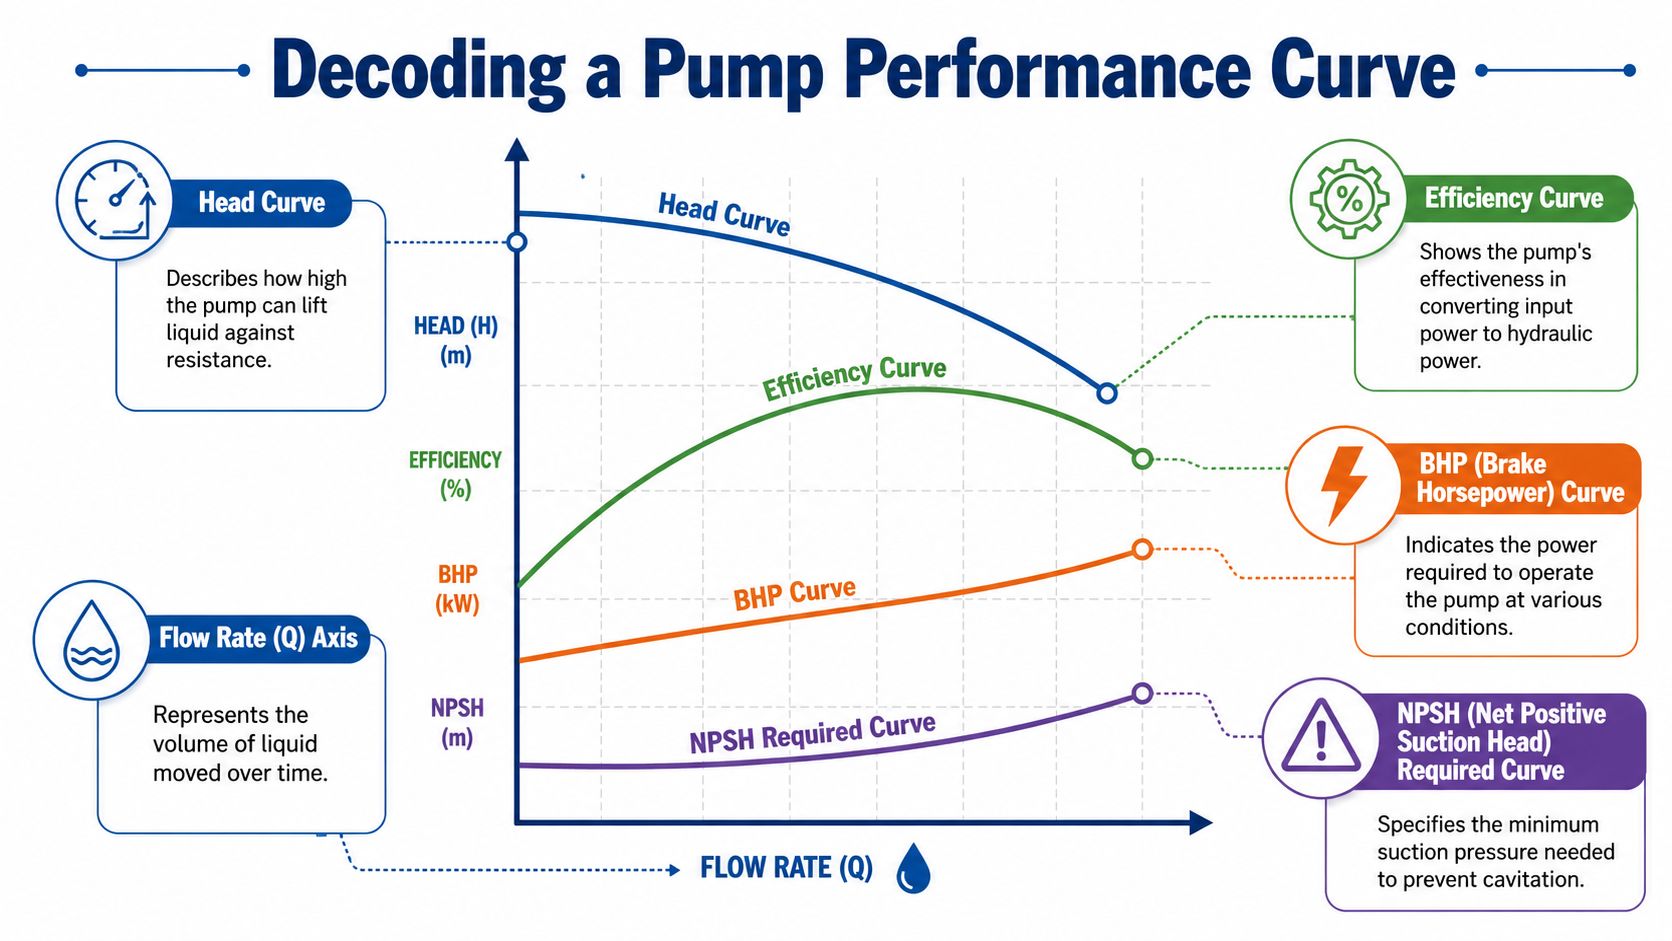
On many pump charts, the horizontal axis shows flow and the vertical axis shows head or pressure. For centrifugal pumps that often means m3/h and metres of head. For the hydraulic gear pumps most UK engineers deal with, it is more likely to be L/min, cm3/rev, rpm, and bar. The layout changes between manufacturers, but the job is the same. You are checking what flow the pump will deliver at a given operating condition, and what input or losses come with it.
With gear pumps, be careful not to read the curve as if it were a centrifugal pump chart. A fixed-displacement gear pump does not produce a classic falling head-versus-flow curve in the same way. In practice, the chart often shows theoretical flow, actual flow, volumetric efficiency, mechanical efficiency, and input power across a pressure range at a stated speed and oil viscosity. That distinction matters. If you use a centrifugal-pump reading method on a gear-pump datasheet, you can select a unit that looks acceptable but runs hot or feels weak in service.
A practical reading sequence works well:
- Confirm the test conditions. Check speed, oil type, viscosity, and temperature.
- Find the operating pressure or pressure range the machine experiences.
- Read the corresponding flow, not just the theoretical displacement output.
- Check efficiency and input power at that same point.
- Review suction and inlet notes if the sheet includes them.
The main lines that matter
A useful hydraulic pump chart answers four separate questions. What flow will it really give you, how much power will it need, how much loss is happening inside the pump, and whether the inlet side is likely to cause trouble.
| Curve on the chart | What it tells you | Why it matters in practice |
|---|---|---|
| Actual flow or delivery curve | Output flow at a stated speed as pressure rises | Shows whether the machine will still meet cycle-time or actuator-speed requirements under load |
| Volumetric efficiency curve | How much theoretical displacement becomes real output flow | Highlights internal leakage, especially as pressure rises or oil gets thinner |
| Power curve | Shaft power or input power required at different pressures | Prevents overloaded motors, couplings, PTOs, or diesel prime movers |
| Overall or mechanical efficiency curve | How much input energy is lost to friction and internal losses | Helps explain heat generation and poor energy use in continuous-duty applications |
For gear pumps, the actual flow curve deserves more attention than many buyers give it. Theoretical flow comes from displacement and speed. Actual flow is lower once internal leakage is taken into account. As pressure rises, that gap usually grows. On a worn pump, it grows faster.
That is why volumetric efficiency in hydraulic pumps is not just a classroom term. It directly affects ram speed, motor torque, cycle time, and oil temperature.
The power curve catches another common mistake. A pump may deliver the required pressure, but the drive side still has to supply the torque to get there. On mobile plant, that can mean a PTO that runs out of margin at working speed. On industrial equipment, it can mean nuisance motor trips or a coupling that lives a short life.
Units and labels to watch carefully
Small print causes expensive errors.
Manufacturers present hydraulic gear pump data in different ways. One sheet may show pressure in bar and flow in L/min. Another may lead with displacement in cm3/rev and give performance at several speeds. Some publish separate curves for mineral oil at one viscosity and another set for cold-start or lower-viscosity conditions. If you skip those notes, the chart can be read correctly and still be applied wrongly.
Check these labels every time:
- Speed. The curve only applies at the stated rpm.
- Pressure range. Confirm whether the line is continuous-duty, intermittent, or peak only.
- Oil viscosity and temperature. Gear pump leakage and friction losses shift with oil condition.
- Rotation and configuration. Twin pumps, priority blocks, and integrated relief arrangements can change the published data.
- The line definition. Make sure you know whether you are looking at theoretical flow, actual flow, or an efficiency line.
In workshop and field work, I would rather have a plain chart with honest test conditions than a polished datasheet with missing assumptions. Read the labels first, then read the curves. That habit prevents a lot of wrong replacements.
Finding the Best Efficiency Point and Operating Range
The best point on a pump curve isn't the highest pressure or the highest flow. It's the point where the pump works most cleanly.

That point is the Best Efficiency Point, or BEP. The Water Fitters guidance on pump sizing states that, for optimal performance, the system duty point should sit as close as possible to the BEP, typically within ±10% of the BEP flow rate. That's a practical target because it reduces premature wear and energy waste.
What BEP looks like in the real world
On the chart, BEP usually sits near the top of the efficiency curve. In service, it's the point where the pump runs with the least internal distress for the work being done. Bearings, seals, couplings, and the fluid itself all benefit when the duty point stays near that region.
For hydraulic systems, that often translates into steadier response and less avoidable heat. If you're reviewing losses in the wider circuit, it also helps to understand volumetric efficiency in hydraulic systems, because internal leakage and operating condition are part of the same overall performance picture.
What happens when you stray too far
Running too far away from BEP always has a cost. The exact symptom depends on which side of the curve you're on.
- Too far left of the useful range. The pump is working at relatively low flow and higher resistance. Heat can build, and the unit may spend too much time pushing against restriction rather than moving useful volume.
- Too far right of the useful range. The pump is moving towards higher flow conditions where suction and stability issues become more likely, especially if inlet conditions are already marginal.
- Constant operation outside the preferred region. Even if the machine still “works”, service life usually suffers.
The Big Frog Supply overview of pump curves notes that pumps should ideally operate within two-thirds of their curve to avoid issues such as high temperature rise or reduced bearing life. That's a useful screening rule when you're deciding whether a proposed duty point is sensible or merely possible.
This short visual gives a good sense of how efficiency and operating position interact on a typical chart.
A better selection mindset
Don't ask only, “Can this pump hit the number?” Ask, “Can it live there?”
That shift changes decisions. A pump that reaches the target at the edge of the chart is often a poorer choice than one that meets the same duty near its efficient, stable range. Engineers who make that distinction usually see fewer heat complaints, fewer seal problems, and fewer arguments about why the machine looked fine on paper.
Matching the Pump to Your System Requirements
Pumps don't choose their operating point. The system does.
That's why two identical pumps can behave differently on two machines. The pipework, valves, fittings, actuators, filters, and height changes in the circuit create the resistance the pump has to overcome. Until you account for that, any selection is incomplete.
Find the true duty point
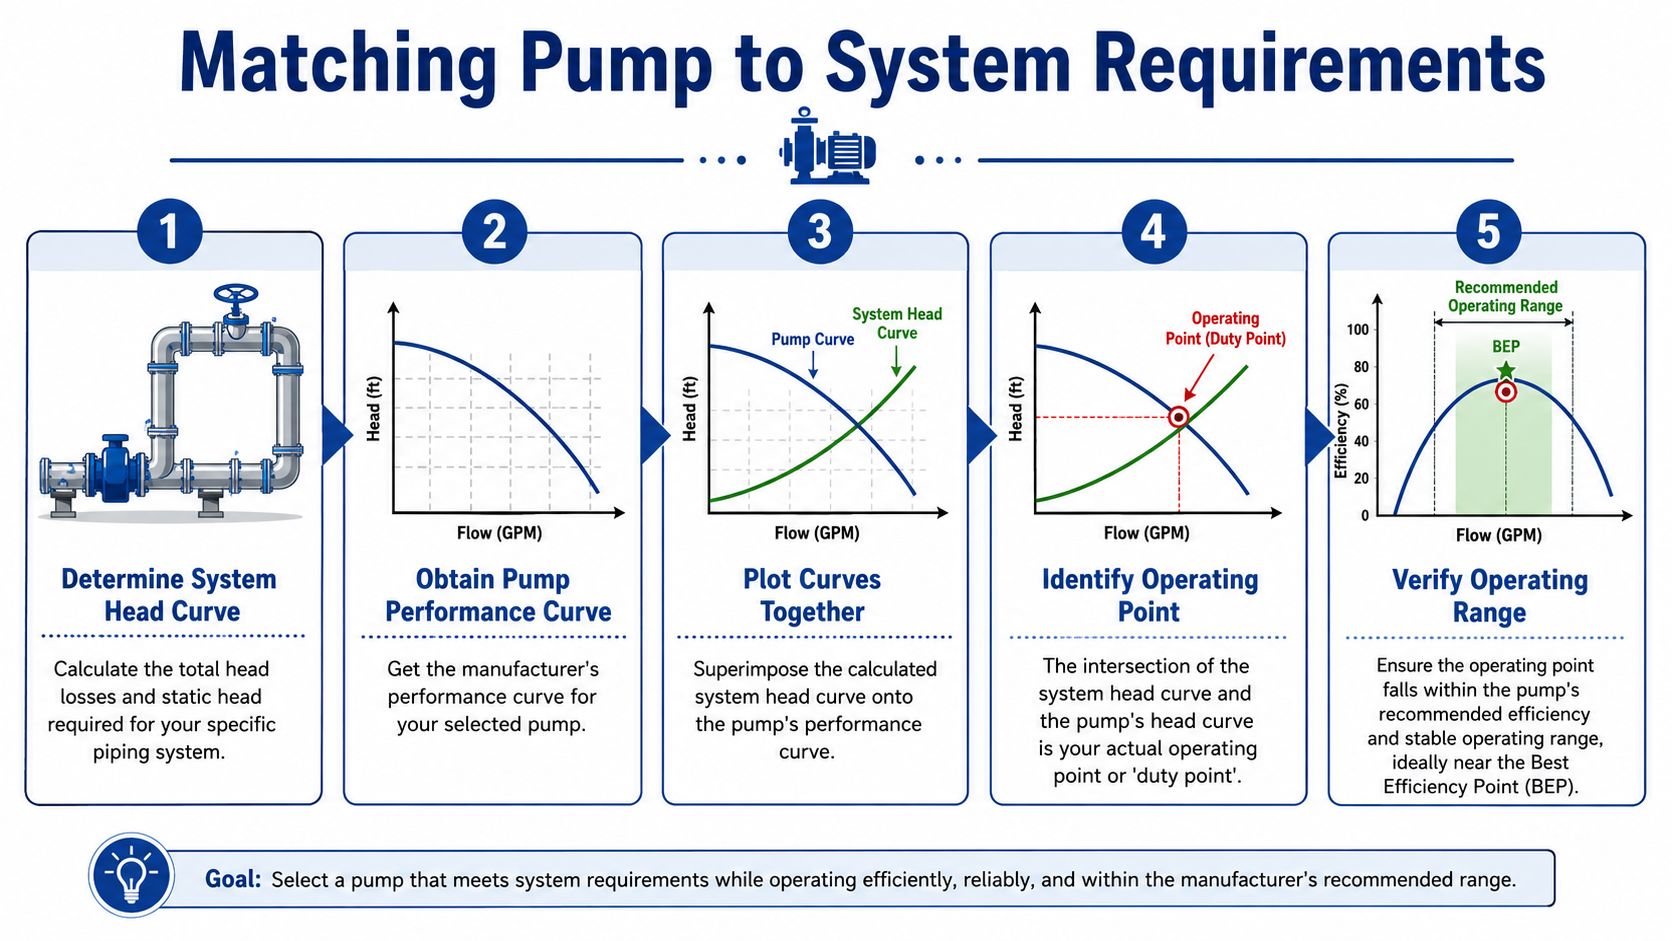
The John Brooks explanation of system curve calculations puts it plainly. The system duty point is determined by the intersection of the pump's performance curve and the system's resistance curve, and the system resistance is the total dynamic head required, made up of static head and frictional losses from pipes, valves, and fittings.
That intersection is where the pump will run.
A practical way to build the system curve
If you're working from scratch, keep the process orderly rather than trying to estimate the answer in one jump.
-
List the fixed conditions
Start with what the machine must do. Required flow, required pressure at the actuator, fluid type, operating temperature, and expected speed range all belong on the first page. -
Separate static and friction effects
Static head is the unavoidable lift or elevation difference. Friction losses come from movement through pipework and components. Filters, control valves, heat exchangers, bends, and quick-release couplings all add resistance. -
Plot how resistance changes with flow
Static head stays fixed. Friction rises as flow rises. That's why the system curve typically steepens as demand increases. -
Overlay the manufacturer's pump curve
Once both lines are on the same axes, the intersection gives the actual operating point.
If you need a structured starting point for sizing the flow side before plotting, hydraulic flow rate calculations are worth reviewing because mistakes there tend to ripple through the whole selection.
Oversizing is not a safe option by default. An oversized pump still has to find a balance point, and that can push the machine into heat, noise, and poor controllability.
What works and what doesn't
A few habits consistently produce better outcomes.
- Good practice means using the actual installed resistance, not a sketchy estimate from memory.
- Poor practice is selecting from pump displacement alone and assuming the relief valve will sort the rest.
- Good practice means checking the whole operating range, especially on systems that don't stay at one load.
- Poor practice is plotting a single ideal point and ignoring startup, warm oil, cold oil, and partial-load behaviour.
For commercial UK applications, the National Pumps and Boilers guide to interpreting performance curves recommends plotting the duty point and checking that the selected pump positions it within 70-120% of the BEP flow rate, while also designing with a 5-10% margin for real-world conditions. Even if your application is hydraulic rather than heating water, the logic holds. Leave sensible room for reality.
One quick sense check
Before approving a selection, ask three simple questions:
| Check | If the answer is no |
|---|---|
| Does the duty point land on the pump curve? | The pump can’t meet the system as configured |
| Is the point near the preferred operating region? | Expect efficiency or service life problems |
| Does the curve still make sense across the load range? | The machine may behave well only under one narrow condition |
That discipline is what turns a pump curve from a catalogue graphic into an engineering tool.
Checking Cavitation Risk with NPSH
A pump can meet duty on paper and still fail early if the suction side is wrong.
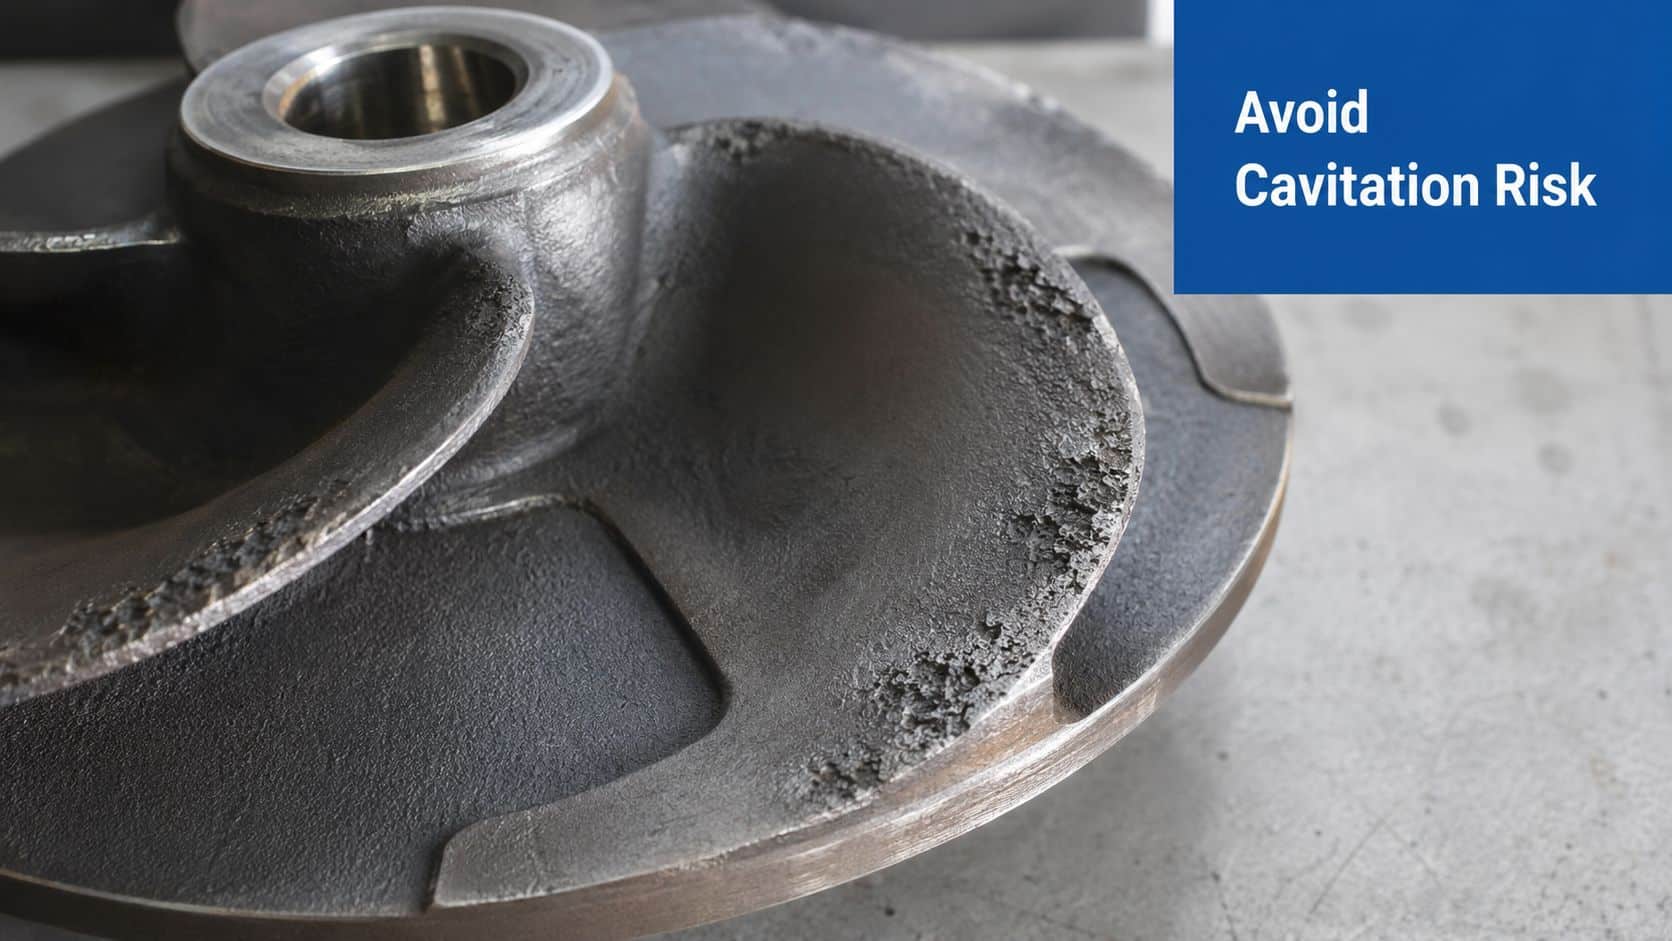
Cavitation usually announces itself through noise, vibration, erratic performance, and damage that looks far worse when the pump is opened than when it was running. The cure starts with one check that too many people leave until late in the job.
Read NPSHr, then compare it to your system
The Castle Pumps explanation of pump curves and NPSH states that Net Positive Suction Head Required (NPSHR) is the minimum pressure needed on the suction side to avoid cavitation, and NPSHA must be higher than NPSHR, typically with a safety factor of at least 1 m in UK industrial applications.
That's the rule that matters. Your system's available suction head must exceed what the pump requires.
What affects NPSHA in practice
On real hydraulic installations, available suction conditions are affected by more than just the pump itself.
- Tank position affects whether the inlet is being helped or hindered by fluid level.
- Suction line design matters. Small-bore hose, tight bends, long runs, and restrictive fittings all cost you.
- Fluid condition matters as oil temperature changes.
- Filter choice and maintenance matter because a loaded suction element can erode the margin you thought you had.
If you want a deeper look at failure symptoms and prevention, pump cavitation in hydraulic systems is worth understanding alongside the curve data.
If suction conditions are marginal during commissioning, they usually get worse in service, not better.
A simple workshop-level check
You don't always need a complex model to spot risk early. Ask:
- What does the pump require at the intended flow?
- What can the suction side really provide once hose length, fittings, and filters are included?
- Is there still clear margin left when the oil is hot and the machine is working?
The CSI Designs guide to reading a pump curve also notes a recommended minimum safety margin of 5 feet, or 1.52 m, between NPSHa and NPSHr for process piping systems. Different sectors express the margin differently, but the engineering message is the same. Leave headroom.
The warning signs engineers should take seriously
Don't write these off as “just how the machine sounds”:
- Sharp inlet noise
- Vibration that rises with demand
- Pitted internal surfaces
- Performance that falls away as temperature increases
By the time cavitation damage is visible, the pump has usually been telling you for a while.
Real-World Application and Troubleshooting Tips
A gear pump that behaves perfectly on the test bench can still disappoint once it is fitted to a telehandler, tractor, press, or power pack. In UK mobile and industrial service, the problem is rarely the catalogue line on its own. The problem is how that line shifts once engine speed, oil temperature, valve settings, and inlet conditions start changing through a normal working day.
That matters more with hydraulic gear pumps than many generic pump-curve guides suggest. Centrifugal pump tutorials often assume a broad operating curve and a relatively stable process duty. A fixed-displacement gear pump in a real hydraulic circuit is less forgiving. Flow rises with speed, leakage changes with pressure and viscosity, and small suction-side mistakes show up quickly as noise, heat, or slow functions.
Variable speed changes the result in service
A catalogue curve taken at one shaft speed is only valid at that speed. If the machine idles at one rpm, works at another, and sees peak demand somewhere else, the actual operating point moves with it. On mobile equipment, that is normal.
Often, selection errors begin. Engineers compare the required flow to a single published curve, then wonder why steering is lazy at idle or why an attachment feels harsh at high engine speed. The pump may be sound. The interpretation was too narrow.
On gear pumps, treat speed as part of the specification. Check the expected flow and pressure at minimum working rpm, normal operating rpm, and any short-term peak condition the machine will see.
Use the duty point to diagnose faults faster
When performance drops off, the curve helps narrow the fault instead of swapping parts on guesswork.
-
Duty point sits left of expectation
System resistance is usually higher than assumed. Check for blocked return filtration, partially closed valves, pressure-control settings that are too high, or actuators seeing more load than the original design case. -
Duty point sits right of expectation
The circuit may be asking for more flow than the pump or inlet arrangement can support cleanly. Check suction hose size, tank outlet condition, inlet fittings, and whether pump speed has crept above the original design point. -
Machine works cold, then slows when hot
Start with viscosity and internal leakage. A worn gear pump can look acceptable on cold oil and fall away badly once the oil thins out. -
Replacement pump is the same displacement but performance changed
Confirm actual test data, rated speed, direction of rotation, shaft loading limits, and porting. Equal displacement does not guarantee equal volumetric efficiency or the same pressure capability.
One good pressure reading and one good flow reading, taken at the same time, are often enough to stop an expensive wrong turn.
Common mistakes on UK mobile and industrial systems
The same issues come up repeatedly in the field.
On mobile plant, pumps are often judged at full throttle even though the operator spends much of the day below that speed. That leads to weak low-speed response and unnecessary heat once the machine is worked harder. On industrial packs, the opposite mistake is common. The pump is sized for a theoretical maximum duty, then spends most of its life across a relief valve because no one checked the normal operating case.
Coupling these errors with a marginal suction layout makes the symptoms harder to read. The pump gets blamed, then the relief valve, then the oil, when the actual problem is that the installed system never matched the published curve in the first place.
On a gear pump installation, the curve is a commissioning tool and a fault-finding tool, not just a buying guide.
What usually works in practice
Start with measured machine conditions, not assumptions. Record actual shaft speed, working pressure, oil temperature, and delivered flow where possible. Plot those against the published data from the pump manufacturer. If the installed duty point does not line up with what was specified, check the circuit before replacing hardware.
This approach saves time and money. It also avoids the familiar cycle of increasing relief settings, changing hose sizes at random, and fitting another pump that inherits the same system problem.
If you need selection help for a gear pump, power pack, valve block, or a complete hydraulic circuit, phone 01724 279508 and speak to the MA Hydraulics team.
